| |
| Spemann
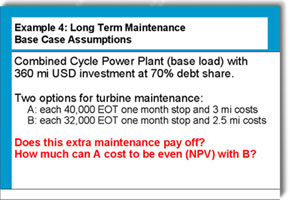
PG-ROI offers the result from
the comparison of the two projects in
its Delta Analysis. |
| |
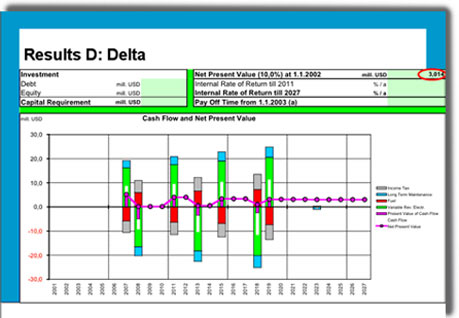
| The
graphic shows the benefit of the first
option over the second option, so that
in the year 2007, when no downtime is
needed, the benefit is additional revenues
(positive green column) accompanied
by additional fuel costs (negative red
column), but the not-spending on maintenance
costs (positive blue column 2.5 mUSD). |
| |
| |
| |
|
|
xx |
 |
| |
This
picture changes in the following year 2008,
when the exact contrary occurs: loss of
revenues, but savings in fuel costs during
down time. Additionally, the costs of maintenance
apply (3 mUSD, negative blue column).
The same sequence of up and down takes place
in the following years until finally there
is one downtime saved and the cash-flow
remains positive.
The
Net Present Value for saving one downtime
results in 3.014 mUSD, even though the costs
for each maintenance cycle are higher. |
|