|
|
|
zz |
|
| |
|
|
PG-ROI
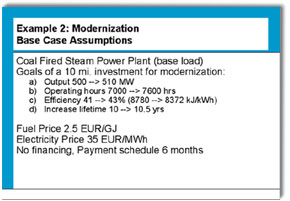
EXAMPLE 2
Analysis
of a Modernization
Base Case Assumptions |
|
 |
x |
 |
|
| |
|
|
| |
Spemann
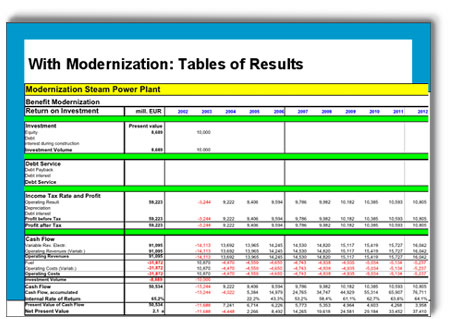
PG-ROI represents
all results not only in
graphic form, but also in
tables.
The interpretation of the
project‘s benefits
is easier using the charts,
but for any further detailed
calculation, the tables
might be helpful, too.
The tables with results
exist for the three options
“With Modernization”,
“Without Modernization”
and “Delta = Net Benefit
of Modernization” |
| |
|
|
xx |
|
|
|
|
|
|
|