| |
Spemann
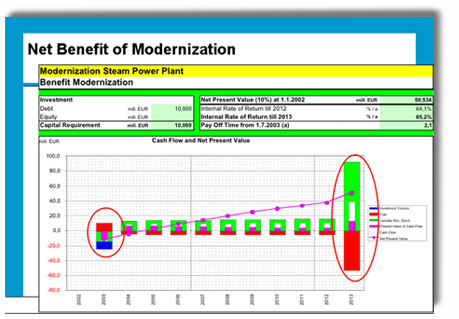
PG-ROI automatically
calculates the difference
of the two cash-flows by
subtracting one from the
other.
All revenues and costs that
are not affected by the
modernization cancel each
other out, remaining only
the components that have
changed. |
|
|
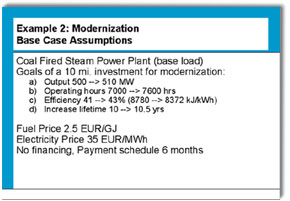
| Important
is the year of the modernization
(2003): the columns of revenues
and costs are reversed:
The loss of revenues during
the downtime is represented
by a negative green column
(negative revenue = loss
of revenue), on the other
side there are savings of
fuel costs, represented
by the positive red column. |
| |
| In
addition, there is the blue
column that represents the
price of the project (10
mEUR). |
| |
|
|
xx |
 |
| |
After
the modernization ends, the plant
generates more revenues than without
modernization (higher output,
more operating hours) during several
years, while the fuel costs only
increase a little (the effect
of enhanced efficiency).
At the end of the lifetime (2013)
becomes obvious the result of
lifetime extension by six months,
so that the modernized plant generates
revenues and fuel costs during
additional 6 months. |
|